April 14, 2008
A perfect spectrum analyzer tool for most non-enterprise and small 2.4GHz Wi-Fi network users.
Related Articles
- Optimize Your Access Points
- Review: AirMagnet’s OQO Analyzer/Survey Bundle
- Municipal Wi-Fi Network Surveying and Testing: Part II
- Municipal Wi-Fi Network Surveying and Testing: Part I
Wi-Spy 2.4x Wireless Spectrum Analyzer
$399, www.metageek.net
Pros: relatively inexpensive; easy to set up and use; external connector allows use of custom antennas
Cons: doesn’t handle 5 GHz spectrum; included Chanalyzer software is Windows-only
Life is good if you’re a frequent Wi-Fi user these days—wireless networks have become so prolific that there seem to be several available in any given location. But this ubiquity can have a definite downside if you’re the person responsible for keeping a Wi-Fi network running properly, especially if you’re trying to do so in a densely-packed office setting surrounded by other businesses that have wireless networks of their own. After all, having only three non-overlapping channels in the 2.4 GHz band used by 802.11b/g/n can make for some pretty cramped airspace, and that’s before you even consider common interference-causing devices like cordless phones, microwaves, etc.
Those looking to employ something more than blind guesswork when it comes to identifying potential wireless networking problems will appreciate the capabilities of MetaGeek’s Wi-Fi 2.4x, a spectrum analyzer that can help you discern how well—or poorly—your wireless signals actually fare in the air.
The $399 Wi-Spy 2.4x consists of both a hardware and a software component; the former is a USB dongle-style device–no bigger than a Flash memory drive—with an RP-SMA antenna connector (and an included, small omnidirectional antenna). To record and display the data collected by the Wi-Spy 2.4x, you get Chanalyzer 3.0, an analysis utility that runs on Windows 2000 through Vista and requires the Microsoft .NET 2.0 framework. Chanalyzer only works with Windows, but third-party utilities compatible with Mac OS X and Linux are available for download from the MetaGeek Web site.
We popped the Wi-Spy 2.4x into a Vista notebook, and after a simple installation process we were soon presented with a series of colorful graphs depicting the activity within our wireless landscape.
What’s the frequency, Wi-Spy?
Chanalyzer provides three main views, spectral, planar, and topographic, which you can show/hide and resize as needed and that provide different vantage points from which to visualize your signal data. Chanalyzer’s planar view, for example, displays the current amplitude of wireless signals across each frequency and against a backdrop of both the maximum and average signal levels. A spectral view lets you see the same information plotted historically over a long period of time.
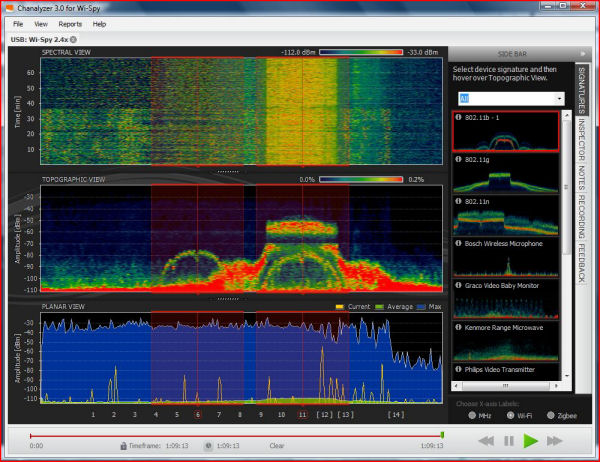
Both the planar and spectral views within Chanalyzer give you an easy way to see which wireless channels are the busiest and which have little or no activity. But it’s Chanalyzer’s topographic view that will be most useful when it comes to discerning where any competing wireless signals might be coming from, especially for those that aren’t wireless technology experts. The topographic view consists of an amplitude/frequency graph that displays physical representations, or signatures, of the signals detected. Since different kinds of wireless devices have different signatures, they can be used to recognize the kind of device generating the signal.
Look for the signs
Assisting in the task of signal identification is Chanalyzer’s Signature sidebar, which contains about a dozen signatures representing a range of wireless devices from 802.11 b, g, and n access points to non Wi-Fi 2.4 GHz devices like a baby monitor, microwave, cordless phone, audio/video transmitters, and a wireless USB mouse. For example, an 802.11b network signature resembles a rounded bell curve, while the signature of an 802.11g device looks more like a mesa, with a broad flat top and steep sides. Many other devices display signatures consisting of various spikes (especially those that frequency-hop). For easier comparison, you can select a particular signature and then overlay it directly atop the topographic view.
Chanalyzer provides other helpful visual aids too. You can configure the graphs to display either the range of frequencies in MHz, or the Wi-Fi channels that correspond to each. When using the latter, placing the cursor over a channel number will mask off the range used by the channel, which makes it easier to see where channel overlap (and thus interference) may be taking place. An Inspector tool will display data about any point on the graphs when you move the mouse over them. You can highlight areas of interest by double-clicking anywhere within a graph to place markers.
Turn on, tune in
Like a TiVo that’s always recording whatever it’s tuned to, Chanalyzer automatically records all the live data as it’s collected by the Wi-Spy 2.4x. An adjustable timeline control lets you view data recorded earlier or focus on a specific narrow period, and you can also save recordings for future reference, complete with text annotations. MetaGeek also maintains a library on its Web site of recordings created either by the company or by members of the Wi-Spy user community. Playing back the recordings can be another useful way to identify sources of interference.

In our time with the Wi-Spy, we let Chanalyzer run for about six hours, and upon viewing the data were easily able to discern a variety of problem areas, including nearby access points occupying the same channel and a 2.4 GHz wireless mouse that was causing periodic interference.
Wi-Spy 2.4x’s $399 may seem dear, but its price tag is but a fraction of the cost of most spectrum analyzer products (like those from AirMagnet, among others). What you get with the higher-end products, but not with the Wi-Spy 2.4x, is the ability to do things like analyze the contents of Wi-Fi traffic and check security configurations. By contrast, the Wi-Spy 2.4x only concerns itself with the physical signals, but that’s all most non-enterprise and small network users are likely to need.
It’s also worth noting that the Wi-Spy 2.4x is a follow up to–but not a replacement for–MetaGeek’s original Wi-Spy product ($199), which we looked at back in 2006 (and is now referred to as Wi-Spy v1). The newer 2.4x version improves upon its predecessor by providing higher frequency and amplitude resolution than the original, the RP-SMA connector that allows the use of a variety of external antennas (compared to v1’s fixed internal antenna), and a more recent and capable version of Chanalyzer (the earlier 2.1 version lacks the signatures feature, for example).
Finally Wi-Spy 2.4x can only analyze the 2.4 GHz wireless spectrum, not the 5 GHz band used by 802.11a and dual-band 802.11n devices. This shouldn’t be an issue for most considering that the latter is much less frequently used and is less subject to interference, but MetaGeek says it plans to release a 5 GHz-compatible version of the Wi-Spy in May.
Anyone that needs to keep a 2.4 GHz Wi-Fi network in crowded environs will want to check out the Wi-Spy 2.4x.
Joseph Moran is a frequent contributor to Wi-FiPlanet.
- How to Protect Your Wi-Fi Connection - May 3, 2024
- 5-9-14 Eyes Countries & What they mean - September 20, 2022
- A List Of The Best Free and Public DNS Services - September 19, 2022